On this website, Dr Pascal Vrticka provides a comprehensive introduction into the most important issues researchers are facing when planning and carrying out fNIRS hyperscanning studies.
Please feel free to get in touch with Dr Vrticka if you have any questions, remarks and/or ideas on how to extend this content as well as how to ensure its wider dissemination as part of workshops, webinars etc. – see here for Dr Vrticka’s contact information or use the Question / Feedback Form at the bottom of this page.
Copyright © 2026 Dr Pascal Vrticka. All rights reserved.
Do not reproduce any materials from this website without explicit permission.
The content available on this website was presented at the following events as part of interactive workshops, webinars etc.:
JUNE 2025

2025 Artinis Hyperscanning Summer School: The Versatility of Hyperscanning to study group interaction, organised by Artinis Medical Systems.
MAY 2025

2025 SoNeAt Lab fNIRS Hyperscanning Workshop at the University of Essex in Colchester, UK – in association with Artinis Medical Systems.
January 2024

NIRx online webinar series on fNIRS Hyperscanning – two part webinar covering the complexity of fNIRS hyperscannin Rome), the SoNeAt Lab & Artinis Medical Systems, and hosted by SIRG SoNeAt as part of SEAS.
August 2023

10th International Summer School in Biomedical Engineering held at the Max Planck Institute for Human Cognitive and Brain Sciences (Leipzig, Germany).
May 2023

Functional near-infrared spectroscopy (fNIRS) hyperscanning workshop held at the Department of Psychology, University of Essex (Colchester, United Kingdom). The workshop was supported by Trinh Nguyen (Italian Institute of Technology, Rome), the SoNeAt Lab & Artinis Medical Systems, and hosted by SIRG SoNeAt as part of SEAS.
The following freely accessible recordings of Dr Vrticka’s introduction to fNIRS hyperscanning presented at the above events are available:
Artinis Summer School Part I (2025)

Artinis Hyperscanning Summer School
Keynote 1: Theory & Experimental Design for fNIRS Hyperscanning Experiments
Artinis Summer School Part II (2025)
Artinis Hyperscanning Summer School
Keynote 2: Practical Insights for Analyzing Hyperscanning Datasets
NIRx Webinar Part I (2024)

NIRx webinar series on fNIRS Hyperscanning
fNIRS Hyperscanning: Underlying Theory and Experimental Design
NIRx Webinar Part II (2024)
NIRx webinar series on fNIRS Hyperscanning
fNIRS Hyperscanning: Practical Considerations for Data Analysis
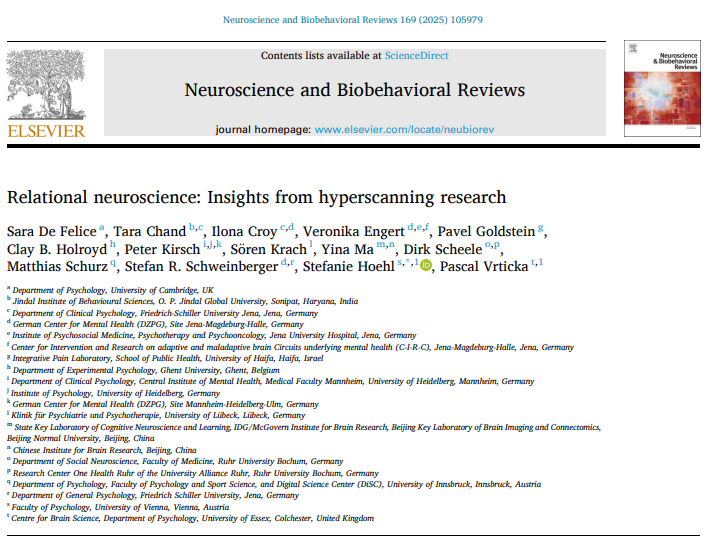
Make sure to also check out our new theory article on Relational Neuroscience and Hyperscanning
(published open access in Neuroscience and Biobehavioral Reviews):
fNIRS Hyperscanning – An Introduction
Outline:
1. What is fNIRS Hyperscanning?
2. What is the main measure derived from fNIRS hyperscanning?
3. How do I choose the best optode template?
4. How do I ensure that I obtain high quality fNIRS hyperscanning data?
5. Which data analysis steps does fNIRS hyperscanning involve?
6. How is interpersonal neural synchrony derived from fNIRS hyperscanning data?
7. What about control analyses?
8. What else do I need to keep in mind?

1. What is fNIRS hyperscanning?
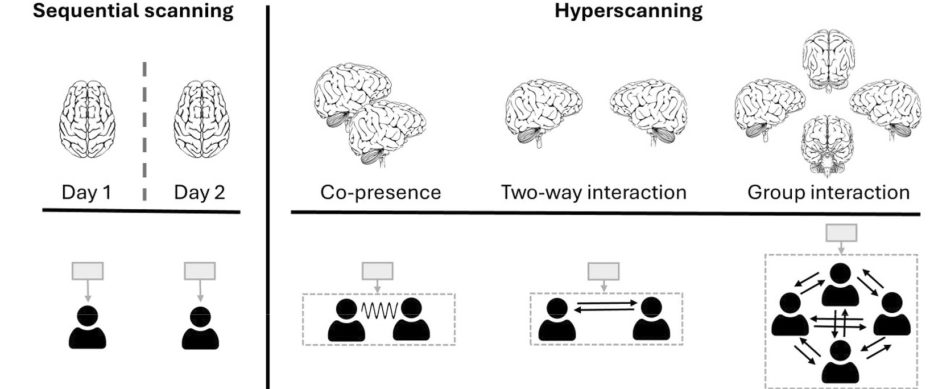
Broadly speaking, hyperscanning refers to the simultaneous measurement of physiological signals from at least two participants who are engaging with the same task or stimulus (as opposed to sequential scanning that is performed for each participant individually / at a different time). The term “hyperscan” was coined by Montague et al. (2002) and specifically referred to measuring the neural substrates of human social interaction by means of functional magnetic resonance imaging (fMRI) hyperscanning. Since then, the concept of hyperscanning has been extended to also include other neuroimaging methods like electroencephalography (EEG; e.g., see Dumas et al., 2010), functional near-infrared spectroscopy (fNIRS; e.g., see Cui et al., 2012) and magnetecephalography (MEG; e.g., see Baess et al., 2012). Hyperscanning setups comprise co-presence (i.e., passive exposure to the same stimuli without interaction) as well as two-way and group interaction.
Moreover, hyperscanning also considers interpersonal dynamics across other modalities, including behavioural data (e.g., touch, eye gaze, vocalisations, etc.), peripheral physiology data (e.g., heart rate, etc.) and endocrinology data (e.g., secretion of hormones such as cortisol, oxytocin, etc.) within the greater realm of bio-behavioural synchrony (BBS; e.g., see Feldman, 2017).
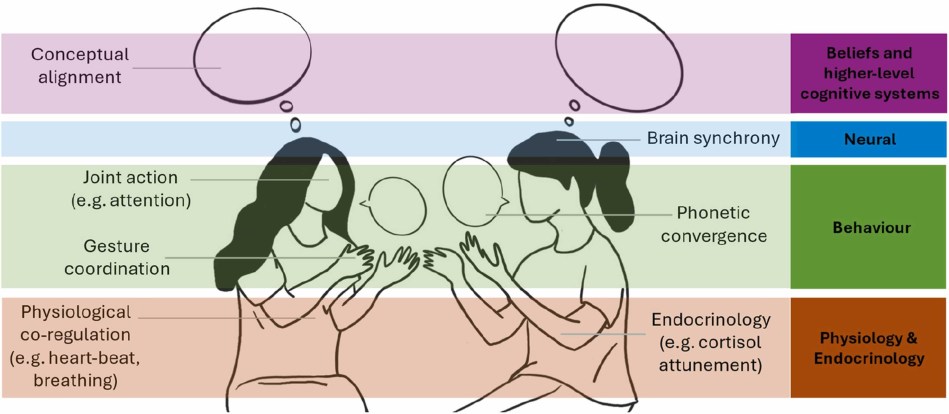
Visual illustration of interpersonal dynamics across different modalities during naturalistic interaction. Adapted from Figure 3 in De Felice et al. (2025).
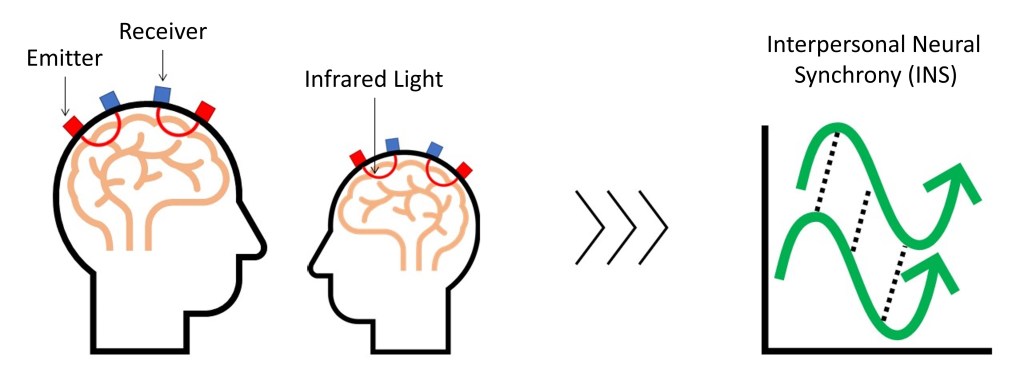
fNIRS hyperscanning more specifically uses infrared light absorption to indirectly measure brain activation based on changes in both oxy- and deoxyhemoglobin (HbO and HbR, respectively) – see Figure “fNIRS Hyperscanning Setup” below. fNIRS is thus most closely related to fMRI. However, fNIRS has several advantages over fMRI (and other neuroimaging methods), including its relatively low cost, strongly reduced susceptibility to movement artefacts and greatly enhanced ecological validity. fNIRS therefore is particularly well suited for studies involving infants and children and allows for the assessment of social interactions in much more naturalistic settings – especially when employing the the newest portable / wireless fNIRS devices.

2. What is the main measure derived from fNIRS hyperscanning?
The main measure derived from fNIRS hyperscanning is synchrony. Synchrony is defined by Oxford Languages as “simultaneous action, development, or occurrence“. When employing fNIRS, synchrony is observed at the neural level and thus as the correlation of brain activity across two or more individuals over time during and shortly after social interaction, also known as interpersonal neural synchrony (INS) or interbrain synchrony (IBS).
Importantly, the concept of INS differs somewhat from the general definition of synchrony provided above – as INS does not require the individual brain activation signals to be occurring simultaneously or to be exactly the same. In other words, there can be high INS not only if both individual signals are “in sync” (i.e., in phase), but also if there is a consistent phase shift (i.e., one signal always precedes or follows the other), or even if the two signals are in opposite or anti-phase. The determining variable underlying INS therefore is temporal coherence or contingency (for more details, see also “6. How is interpersonal neural synchrony derived from fNIRS hyperscanning data?” below).
For a summary of terms used in Relational Neuroscience to describe the dynamics between signals originating from at least two people in a social context, please see here. More detailed information can also be found in Table 1 in De Felice et al. (2025).

3. How do I choose the best optode template?
Before any fNIRS hyperscanning data can be acquired, the most suitable optode template needs to be chosen. The optode template is the arrangement of emitters and receivers that are going to be placed on participants’ heads. All fNIRS data acquisition software packages have pre-installed optode templates amongst which a suitable one can be picked. Some software packages even have optode template builders that can be used to create custom arrangements. As a rule of thumb, as long as the inter-optode distances are kept at 30 mm (for adults – for infants, the distances are smaller), and associations between emitters and receivers remain consistent with the template, templates can be freely rotated to cover the desired brain area(s).
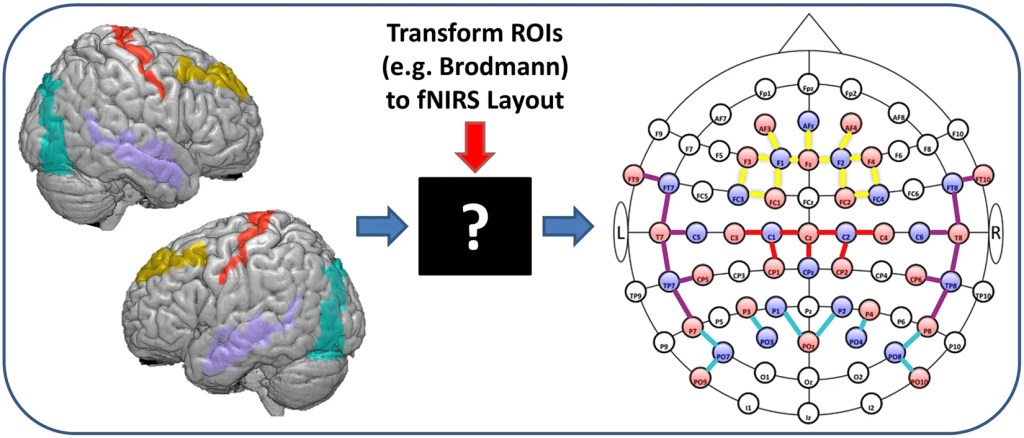
A common challenge that fNIRS hyperscanning researchers are facing is the translation of study hypotheses to an fNIRS optode layout by choosing appropriate sources and detectors positions to maximize anatomical specificity to regions of interest.
One approach commonly used to tackle this challenge is to refer to the EEG 10/20 system and place optodes relative to EEG electrode sites (which often are printed on the fNIRS caps). Another approach is to use the fNIRS Optodes’ Location Decider (fOLD) toolbox – see Figure “fOLD Toolbox” below (taken from here). The fOLD toolbox automatically decides the location of fNIRS optodes from a set of predefined positions with the aim of maximizing the anatomical specificity to brain regions of interest. Please see here for a webinar by NIRx Medical Technologies about “devfOLD: A Toolbox for Designing Age-Specific fNIRS Channel Placement“.
According to the selected optode template, researchers then need to decide whether they can fit it to pre-punched caps provided from the manufacturer, or whether they need customised caps with holes punched at specific locations. Customisation can either be requested from the manufacturer or caps without holes can be ordered and the punching can be carried out at the researchers’ lab.

4. How do I ensure that I obtain high quality fNIRS hyperscanning data?
Good individual signal quality is key for fNIRS hyperscanning. If data from one channel in one participant is bad, data from this channel also needs to be discarded for the other participant within the same dyad. It therefore is vital to perform a proper signal calibration before starting the fNIRS data acquisition.
Most current fNIRS data acquisition software packages include a simple visual display of signal quality for each measurement channel (e.g., green = good, orange = medium, red = bad) based on SCI or SQI (see section 5 below). Depending on the manufacturer, different steps can be taken, should signal quality be poor. In some cases, signal gain can either be de- or increased and optodes can be placed deeper or higher in the optode holders, and thus closer to or further away from the head. Often, bad signal is due to the infrared light transmission being obstructed by hair and thus any hair should be carefully moved to the side at each affected optode location.
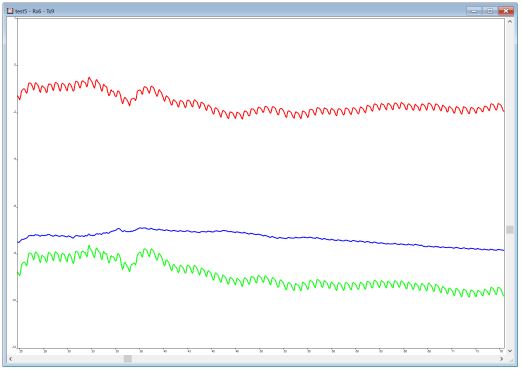
Checking signal quality during calibration can also be done by directly relying on the HbO and HbR signal time courses displayed by the acquisition software. When doing so, a clear heartbeat should be visible in the HbO but only minimal/no heartbeat in the HbR signal (see Figure “Optimal Signal” below). Large peaks / signal deflections in both the HbO and HbR signals are indicative of optode movement relative to the head, which can be improved by tightening the cap. A lot of noise in both signals usually points to little / no light being detected by the receiver, which may be due to hair obstructing infrared light transmission. Conversely, no detectable change in both signals usually means that maximum light intensity is detected by / reaching the receiver and thus that the emitter and / or receiver are not well placed within caps relative to the head surface. It could also be that there is too much ambient light being captured by the receiver. Adjusting optodes and / or using an overcap may be advisable.
Please also see here for a webinar by NIRx Medical Technologies on “Optimizing fNIRS Signal Quality”.

5. Which data analysis steps does fNIRS hyperscanning involve?
There is no unified pipeline for fNIRS hyperscanning data analysis across labs available to date. Data analysis procedures differ as a function of the fNIRS devices themselves as well as previous experience of the labs within which fNIRS hyperscanning is performed. Furthermore, for each individual data analysis step, there are several different feasible options and the order in which they are applied can also vary. Nonetheless, when analysing fNIRS hyperscanning data, the following procedures should be employed at some point or another.
5.1 Data Conversion
Depending on the fNIRS device manufacturer and data analysis software, the raw wavelength data from the measurement device may need to be converted to a specific data format readable by the used software / toolbox (for example,*.nirs). For subsequent analysis steps, the wavelength data then usually is further converted into raw optical density data (OD).
5.2 Bad Channel Detection and Rejection
What follows is a crucial bad channel detection and rejection step. To do so, researchers can choose between different manual versus (semi-)automatic procedures.
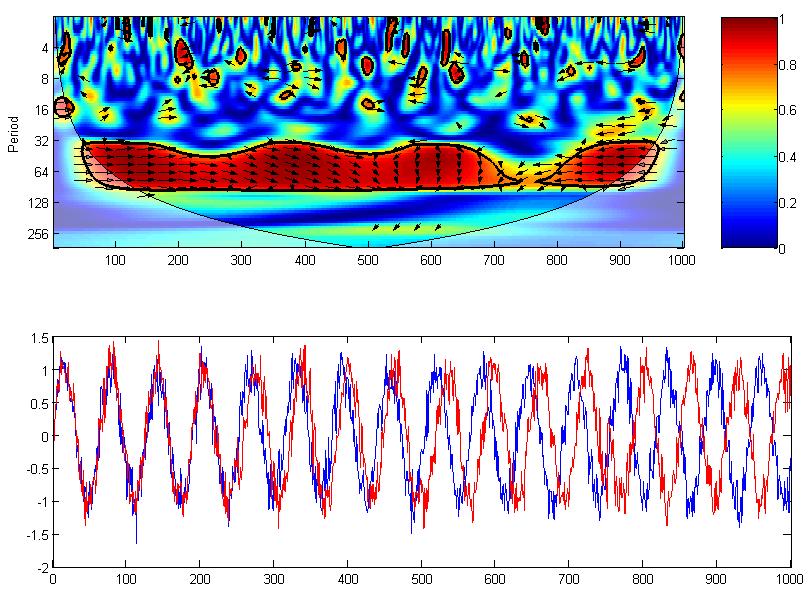
We always recommend a manual visual data quality check, wherever feasible – see Figure “Manual Visual Data Quality Check” below (taken from here). One way to perform such check is to derive WTC plots for each individual measurement channel per participant and to visually inspect the heart band. The heart band should be found at around 0.5 to 1 period seconds in the WTC plot and be consistent and strong. An unclear or absent heart band usually indicates weak signal or complete signal loss at the particular measurement channel. The WTC plot can furthermore inform about important noise in the data or other issues that occurred during data acquisition. See also “6. How is interpersonal neural synchrony derived from fNIRS hyperscanning data?” below to learn more about WTC analysis and plots.

For (semi-)automatic bad data checks, several different methods have been suggested. The most prominent ones are data pruning, the coefficient of variation (CoV) or the scalp coupling index (SCI) / signal quality index (SQI). An overview and summary can be found here.
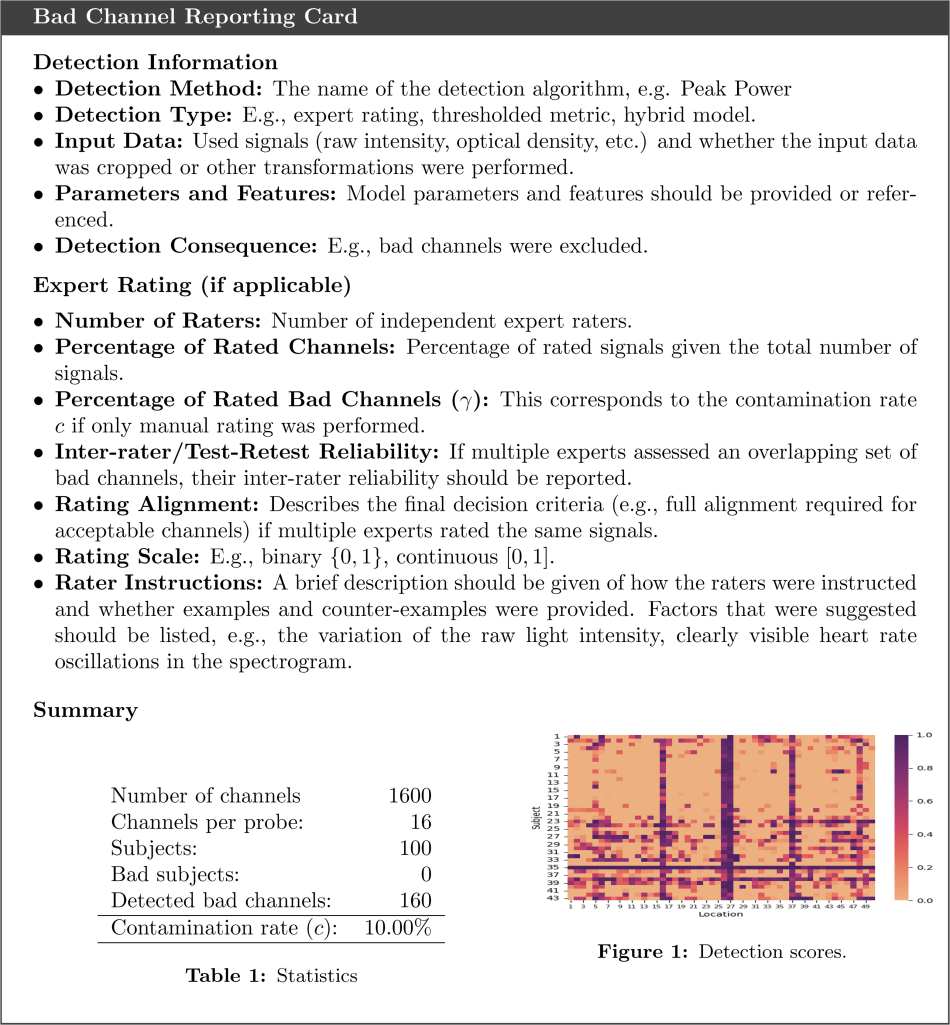
Overall, for bad channel detection and rejection, we recommend using at least one objective data quality check together with the manual visual data quality check to decide about data exclusion based upon the combined information available. Regardless of the approach chosen, researchers should always provide basic information about the detection method, statistics, and detection scores across channels and participants – as provided in the figure below based on recommendations taken from here.
5.3 Spatial Filtering
Another step that should be implemented is spatial (bandpass) filtering to exclude any physiological and other kind of noise, particularly at high and low frequencies. Useful additional reading and illustrations can be found here.
5.4 Artefact Correction
What should also be performed is motion correction and/or additional (physiological) noise removal – see Figure “Motion Correction” below (taken from here). Several options are available to do so, including spline interpolation, principal component analysis (PCA), wavelet thresholding or temporal derivative distribution repair (TDDR). For a recent review of these and additional methods, please see here.

5.5 Short-Distance Channel Regression
Another option that has emerged more recently is the inclusion of short-distance or short-separation channels (SSPs). Usually, for these SSPs, the emitter-detector distance is 10mm – instead of 30mm for regular channels. For more information and additional reading, please see here. Briefly summarised: “A short separation channel measures solely the extracerebral signals, which includes blood pressure waves, Mayer waves, respiration and cardiac cycles. The signal components of the short separation channel can be seen as the “noise” in the signal of the long channel. By removing these components from the long channel, you can minimise this noise.” At the same time, this procedure may not always be trivial because additional steps – besides a simple “removal” or short-separation signal – may be necessary, as explained here. For more information on using short separation channels to correct for systemic contamination during naturalistic neuroimaging, see here.
5.6 Data Conversion
For subsequent analysis, the processed data then needs to be converted to HbO and HbR values.
5.7 Summary
The above data analysis steps can either be performed by using the fNIRS device manufacturers’ own software. Alternatively, researchers can employ: HOMER2/3 in MATLAB, SPM for fNIRS in MATLAB, Brain AnalyzIR in MATLAB, Fieldtrip in MATLAB and / or MNE in Python.

We recently suggested one possible pipeline for fNIRS hyperscanning data analysis comprising (some but not all of) the above steps in a particular sequence, including freely available sample data from 20 parent-child dyads and links to the required hardware and software (based on MATLAB). The OSF directory can be found here: https://osf.io/wspz4/.
For a more recent pipeline also including short-distance channel regression, see here.

6. How is interpersonal neural synchrony derived from fNIRS hyperscanning data?
One of the most important steps in fNIRS hyperscanning is to calculate INS from the individual brain activation signals. This calculation can be done in many different ways. An excellent review of current methods used in regards to fNIRS more specifically, but also haemodynamic and electrophysiological hyperscanning studies using fMRI, EEG and MEG more generally, can be found here. Below, two commonly used approaches in fNIRS hyperscanning to derive INS, namely intersubject correlation (ISC) and wavelet transform coherence (WTC) analysis, are outlined in more detail. To date, the great majority of fNIRS hyperscanning studies has used WTC.
6.1 Intersubject Correlation (ISC)
When using intersubject correlation (ISC) analysis as a measure of INS, a Pearson correlation or robust regression is calculated for specific signal lags and/or frequencies. ISC naturally yields highest positive INS values (i.e., 1) for in-phase signals, lowest negative INS values (i.e., -1) for anti-phase signals and INS values in between for signals more or less shifted in phase. It is also noteworthy that ISC is commonly used to correlate HbO and/or HbR time series themselves and not a derivative of them.
6.2 Wavelet Transform Coherence
When applying wavelet transform coherence (WTC) analysis (see here, here and here), the individual brain activation time series are also correlated using robust regression – like for ISC. However, this only happens after the individual HbO and/or HbR time series were decomposed into different frequency bands and converted to values representing signal strength or power at those individual frequency bands (see Figure “WTC & Phase” below – taken from here). Moreover, WTC analysis yields higher INS values (i.e., closer to 1) regardless of signal lag (i.e., for in-phase signals, signals with phase shifts as well as anti-phase signals), as long as the signals share a consistent temporal contingency. Finally, INS derived from WTC analysis is quite robust to differences in both frequency and amplitude in the source signals.

7. What about control analyses?
When deriving INS by means of ISC or WTC, it is important to keep in mind that there is no implicit INS significance threshold. The obtained INS values from each experiment therefore need to be controlled for spurious correlation. Again, several approaches for such control analyses exist.
7.1 Active Control Condition(s)
A commonly employed approach is to include an active control condition into the experimental design. This enables the comparison of INS between the condition of interest and the control condition – with the hope that INS is significantly higher in the former as compared to the latter. Initially, many fNIRS hyperscanning studies used a passive rest condition as the control condition. While this may work to some degree, there usually is a lot of variance during rest and there may furthermore be some carry-over effects from the preceding active condition. It therefore is better to include another active condition as control condition that is as close to the condition of interest as possible, with some important difference that is thought to be most predictive of INS. For example, an active cooperation condition can be compared to an active individual or competition condition.
7.2 Random Permutation Analyses
While the inclusion of a control condition is helpful, it can still not completely exclude the possibility of spurious correlation. Also, during some experimental paradigms – particularly when examining INS during naturalistic social interaction – there is no adequate active control condition. Therefore, additional and more stringent control analyses have been suggested.
One option is to perform a random pair analysis (i.e., dyad scrambling) in which data from a real dyad is compared to a large number of permutations that pair data from one interaction partner with data from various other interaction partners (who performed the same task but not together as a dyad), thereby forming artificial dyads. The assumption of this permutation analysis is that INS for real dyads should be significantly higher than INS for artificial dyads – which can be statistically tested at various levels (i.e., for each channel, each ROI or as an interaction of channel or ROI with experimental conditions). For more information, see here (end of section 3.3.1 Interpersonal neural synchrony (INS)).
Another option is to shuffle and/or scramble the individual data (i.e., phase scrambling), sometimes even within specific frequency bands (see e.g., here).
Alternative approaches also propose reversing or shifting the individual data, but these approaches should be employed with caution as INS analysis, especially if derived through WTC, takes into account phase shifts (see “6. How is interpersonal neural synchrony derived from fNIRS hyperscanning data?” above).
When performing dyad and/or phase scrambling as a control analysis, researchers can use different approaches.
One approach is to do so channel by channel (or ROI by ROI). For example, when using dyad scrambling, coherence values are compared between real and artificial dyads for each individual channel. If doing so, data from real dyads should subsequently only be considered valid and used for further analyses for a given channel (or ROI) if the real versus artificial dyads comparison is significant for that specific channel (or ROI). In other words, if an analysis comprises 10 channels (or ROIs) but the real versus artificial dyads comparison is only significant in 5 of them, data from real dyads should subsequently only be considered valid and used for further analyses for these 5 channels (or ROIs). The data from the other 5 channels (or ROIs) should not be analysed any further.
Another approach is to perform the real versus artificial dyads comparison as part of General Linear Mixed Models (GLMMs). For example, if a fNIRS hyperscanning experiment has two experimental conditions and four ROIs, a first model should be set up with a 2 (condition) by 4 (ROIs) by 2 (dyads: real versus artificial) factorial design. Within this model, a significant 2 by 4 by 2 interaction should then be present, indicating that the real versus artificial dyads comparison is significant for all comparisons.

8. What else do I need to keep in mind?
When planning an fNIRS hyperscanning study and analysing the data to derive INS, there are several other important issues that need to be considered.
8.1 Task Frequency
INS is usually assessed within a limited frequency range deemed most relevant for the experimental task at hand – i.e., corresponding to the task frequency.
For some tasks, the task frequency can be quite nicely specified – e.g., when there is some sort of external control, such as a given stimulus presentation regularity. For other, and especially more naturalistic tasks, this is not feasible, and INS is thus usually derived from a much broader range of frequency bands. The task frequency range with the highest signal power can, of course, be determined from the data post hoc, but this should not be used in a circular manner – i.e., to pre-select and thus cherry-pick the ideal task frequency range for the reported statistical analyses after the data has already been acquired.
What is also very important to consider when using WTC analysis, is that there are certain frequency bands that are more susceptible to physiological noise, particularly in the cardiac (around 1 Hz), respiration (around 0.2 Hz) and myogenic (around 0.1 Hz) frequency bands (see here). Coherence should therefore ideally only be assessed in frequencies outside of the cardiac and respiration bands, and/or appropriate measures taken to remove as much physiological noise (including from the myogenic band) from the raw data as possible.
8.2 Task / Condition Duration and Cone of Influence (COI)
INS derived from fNIRS hyperscanning data usually represents an average across the duration of a specific task or condition. Common durations are in the range of thirty seconds to several minutes. While there is no absolute limit for task or condition duration on the upper end, there is an analysis-imposed limit at the lower end due to two WTC analysis related particularities (see here and here).
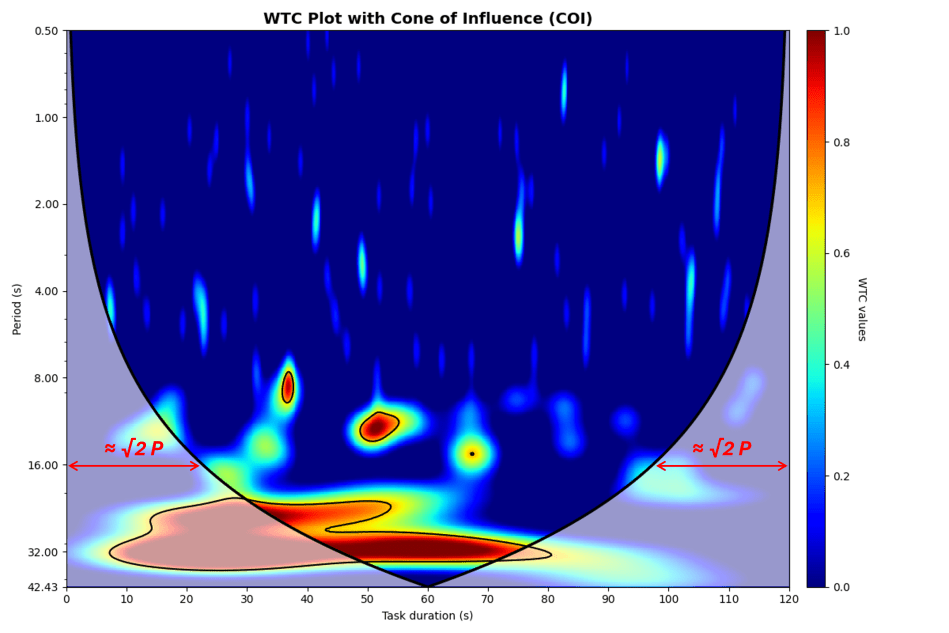
On the one hand, one needs to keep in mind that the wavelet (used in the cross wavelet analysis) is finite and not fully localised in time. Therefore, some data at the beginning and the end of a task or condition will always be lost due to edge artifacts. This is also known as the Cone of Influence (COI). Under standard WTC analysis conditions (i.e., using the Morlet wavelet with ω0=6), the COI will extend approximately 1.4 periods (√2P) from both the start and the end of the time series. For example, for a frequency with the periodicity of 16 seconds, the COI will extend approximately 22.72 seconds at the start and the end of the time series, yielding a total data loss of 45.44 seconds. Importantly, the amount of data loss will vary as a function of the assessed frequency, with the COI increasingly widening the lower the assessed frequency is (see illustration below).
On the other hand, even after removing any data within the COI, WTC analysis doesn’t derive coherence as a point-by-point calculation. Instead, it does so as a local average within a smoothing window (by convolving the wavelet coefficients with a Gaussian window). And this Gaussian window is designed to have a “decorrelation length” that matches the physical size of the wavelet itself. Therefore, under standard WTC analysis conditions (i.e., using the Morlet wavelet with ω0=6), a signal duration of approximately 2–3 oscillations is necessary for a stable coherence estimate after data removal from within the COI.
When combining the COI and smoothing considerations, a general “rule of thumb” emerges to avoid any data loss and contamination as follows: the shortest task or condition duration should be chosen to be four to six times as long as the time it takes for one full oscillation at the lowest assessed frequency. For example, if the lowest assessed frequency is 30 period seconds, the time series should be at least 120-180 seconds long so that a sufficient amount of reliable WTC values can be derived after removing any data within the COI (i.e., no edge artifacts) and estimated with 2-3 full oscillations.
Additional considerations emerge if WTC of very short tasks or conditions that directly follow one another is assessed, and especially if these tasks or conditions have different properties. If, in such scenarios, WTC in low frequencies is estimated, the WTC estimation will either be inaccurate or comprise a large amount of data from outside the task or condition on either side of the window of interest, yielding WTC estimate cross-contamination. Therefore, please be very careful when designing your fNIRS hyperscanning task and/or planning your data analysis to ensure a long enough task / condition duration depending on your frequency of interest! There is no such thing as an event-related fNIRS hyperscanning task!
8.3 HbO and/or HbR Data
There is no absolute consensus to date on which chromophore data should be analysed and reported. However, a recent systematic review identified that most included fNIRS studies analysed and reported either HbO data alone or HbO and HbR data combined, with some also reporting HbR data or the HbR-HbO difference data only. The review also summarises the current perception that HbO data appears to be more sensitive to cerebral blood flow (CBF) changes, has better sensitivity to detecting task-evoked changes and is more strongly correlated with the (fMRI) blood oxygenation level dependent (BOLD) response than HbR. Nonetheless, the recommendation is that HbR data should at least also be analysed and reported (e.g., in the supplement), with some authors suggesting to additionally check for the presence of a negative correlation between HbO and HbR.
8.4 INS Between Corresponding Single Channels / ROIs Versus Between Every Possible Channel Pairing
Many fNIRS hyperscanning studies assess INS between corresponding single channels. For example, for a given number of channels C per participant P in a dyadic setting, INS is examined for C1P1-C1P2, C2P1-C2P2, etc. Similarly, in some cases, certain channels are aggregated to form a region of interest (ROI) and INS is then assessed within corresponding ROIs per participant in a dyadic setting as ROI1P1-ROI1P2, ROI2P1-ROI2P2, etc. Such an approach facilitates the interpretation of observed INS patterns as the same channels or ROIs across the dyad will reflect the same underlying neural computation process linked to their relative anatomical location. It nonetheless remains vital to control for the number of channels / ROIs and thus the number of multiple comparisons.
Alternatively, INS can be assessed for every possible channel / ROI pairing across the dyad, e.g., C1P1-C1P2, C1P1-C2P2, C2P1-C1P2, C2P1-C2P2, etc. While such approach is also feasible, again given the implementation of an appropriate control for multiple comparisons, the resulting INS pattern may be harder to interpret – because increased INS may be observed across different brain areas in the social interaction partners.
8.5 Independent Samples t-Tests Versus Other Statistical Approaches
Related to point 8.4 discussed above is the appropriate choice of the statistical tools for the INS analysis, especially if INS is derived by WTC as the resulting values will be bounded between 0 and 1 and therefore have a beta distribution.
When analysing such data with independent samples t-tests – that are “robust” (meaning they can sometimes handle minor violations) as such -, specific errors regarding variance, boundaries, and skew can be introduced that may invalidate the results. All INS data properties as well as the t-test results should thus be carefully checked.
Another issue with independent samples t-tests is that they, by default, assume that the data from all analysed channels (or ROIs) are independent. However, in reality, this is not the case, as data from channels that are closer to one another will be more similar than data from channels that are further away from each other.
What can be done to overcome these issues? If researchers still wish to analyse their data channel by channel (or ROI by ROI), then they should use a Beta Regression that explicitly models the mean and variance for data bounded between 0 and 1 and naturally handles skewness and heteroscedasticity. A better approach, however, is to use General Linear Mixed Models (GLMMs) with a beta distribution and by including random effects (e.g., to nest individual channels within ROIs). A further advantage of GLMMs is that they can handle missing data.
8.6 Infant / Child Versus Adult Participants
When performing fNIRS hyperscanning in infant / child participants, there are some differences as compared to data acquisition in adult participants. Most fNIRS device manufacturers offer special infant / child optodes that are flat and thus more comfortable to wear. Furthermore, inter-optode distances for infants / children are usually shorter and in the range of 23mm (rather than 30mm). Finally, there will be age-dependent differences in parameters during data pre-processing, for example, a different distal path length factor. For an excellent overview, please check out this webinar by NIRx Medical Technologies about “Infant & Child Imaging with fNIRS” with Dr Susan Perlman.
8.7 Associations between INS and other measures of BBS
Although INS can be examined by itself, it is advisable to acquire at least one additional measure within the greater realm of BBS – e.g., behaviour, physiology and/or endocrinology – and to test for any associations between INS and BBS. INS may furthermore be combined with self-reports and/or semi-structured interviews.
The link between INS and behaviour is important because several contemporary theories about the functional implication of INS are based on considerations of social interaction behaviour. For example, the mutual prediction account of INS explains synchrony in brain activity by a combination of prediction mechanisms concerning one’s own as well as the interaction partner’s behaviour. Another account of interactional synchrony also highlights temporal regularity in interaction partners’ behavioural expressions as key determinant for the alignment of mental processes, in combination with socio-emotional weighting and thus value attribution. It therefore appears vital to show that during a specific task, observed INS is related to social or interaction behaviour (see also “8.8 Correlation versus Causation” below).
More recent studies are also relating INS with other measures of synchrony within BBS besides behaviour. Although theoretically feasible, a practical difficulty in doing so is related to the sometimes very different time scales of the distinct kinds of synchrony. For example, while INS derived from fNIRS hyperscanning typically measures oscillation patterns with medium frequencies, physiology data (e.g., heart rate) has a much higher frequency, while endocrinology data (e.g., secretion of hormones like oxytocin or cortisol) has a much lower frequency. For a given task, it may thus be difficult to find direct associations between INS and synchrony in physiology and / or endocrinology although these processes may indeed be functionally related (for a recent example, see here).
8.8 Correlation Versus Causation
As pointed out in a recent perspective paper, one important question within the field of INS concerns the nature of the relationship between synchrony measured on the neural level and social interaction behaviour. Two perspectives are suggested. On the one hand, INS could be interpreted as a mechanism that causally facilitates social interaction (i.e., mechanistic perspective). On the other hand, INS could be seen as a mere consequence of two (or more) brains processing similar information during a social interaction (i.e., epiphenomenal perspective).
Because of the intrinsic correlational nature of (fNIRS) hyperscanning research, where INS as the dependent variable is correlated with social interaction outcomes as the independent variable, causal effects of INS on social interaction cannot be proved. Several alternative approaches have thus been suggested to prove such causality. One approach involves multibrain stimulation, whereby INS is externally induced and thus becomes the independent variable, and the consequences of externally altered INS on social interaction outcomes as dependent variable are subsequently examined. A few other approaches have also been put forward, including multibrain feedback, the “human dynamic clamp” and mathematical modelling, although these approaches are somewhat controversially discussed.
It should also be mentioned here that both the mechanistic and epiphenomenal perspectives are relevant and valid. The question pertaining to the exact causal relationship between INS and social interaction behaviour should therefore only be assessed as one amongst several others.
8.9 More Synchrony Isn’t Always Better
Most of the so far conducted (fNIRS) hyperscanning studies aim to find increased INS in association with a specific social interaction task. In doing so, higher INS is usually interpreted with positive interaction processes and/or outcomes – or, in other words, that more synchrony is always better.
It may, however, also be the case that during certain situations, too much INS may become problematic – especially if it is context-inappropriate and/or conveys the propagation of stress and other negative emotional and physiological states. Accordingly, some researchers have described an “optimal midrange model” of interactive contingency in which both lower and higher poles of contingent coordination – and possibly also INS – may become detrimental for social interaction and development. More research is clearly needed to address this important issue.
In one of our most recent studies now published in Developmental Science, we found increased INS in mother-child dyads with mothers who scored higher on insecure attachment representations (but no such association in behavioural measures). We furthermore observed increased INS in father-child dyads who simultaneously scored lower in behavioural synchrony (compared to mother-child dyads). These data suggest that higher INS may, under certain circumstances, also be related to a neural compensation mechanism to overcome decreased, or reach comparable levels in other interactional synchrony elements (e.g., behaviour).


